

Waves, Nearshore Currents, and Tides
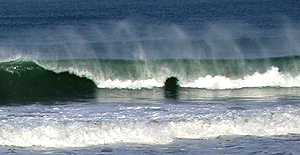
Energetic storm-generated winter waves at La Jolla, CA. Waves move sand on, off, and along the shore. These waves can strip beaches of sand during winter.
Photographer - Memorie Yasuda, image used with permission.
 ost energy in nearshore waters comes from wind-generated waves and tidal currents. The dispersion of water, pollutants, nutrients, and sediments near the coast and the formation and erosion of sandy beaches are some of the common results of nearshore energy dissipation.
![]() Video clip
Video clip
Waves
Waves and the currents they generate are the primary factors in transport and deposition of coastal sediments. Waves move material along the bottom and suspend it for weaker currents to transport.
Rips at Carolina Beach, North Carolina were the result of swells from a hurricane located a few hundred miles offshore (September 11, 2001).
Image courtesy Carolina Beach Police Department, image used with permission.
Rollover the image to highlight the rip current.
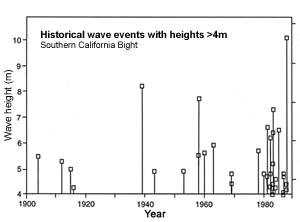
Wave climate - Wave climate history for the southern California Bight over the last century. Incidents with wave heights greater than 4m are shown. Other years had maximum wave heights less than 4m.
Diagram from Inman, D.L. and S.A. Jenkins, 1997.
Click here for a larger image.
Wave action along the southern California coast is seasonal, responding to changing wind systems over the Pacific Ocean. Some waves are generated in the southern ocean and travel 11,000 km (7,000 mi) before breaking on California beaches.
The height and period of the waves depend on the speed and duration of the generating winds and the fetch. The types of waves that break on a beach and their seasonal variance are known as the wave climate.
Deep water waves are long, low, and sinusoidal in form. As the waves enter shallow water, the propagation speed and wavelength decrease, the wave steepens, and the wave height increases until the wave train consists of peaked crests separated by flat troughs. This wave shoaling begins at the depth where the waves "feel bottom." This depth is about one-half the deep-water wave length.
Upon entering shallow water, waves are also subjected to refraction, a process in which the wave crests tend to parallel the depth contours. Simultaneously, wave diffraction causes a flow of energy along the wave crest from high waves to low waves.
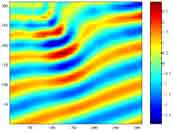
Wave refraction - Wave refraction causes wave fronts to parallel the shape of the coastline as they approach shore and encounter ground. Wave refraction causes wave energy to concentrate on headlands and preferentially erode them rather than bays.
Location TBA. Photograph courtesy - Greg Moore. Permission pending.
Modelled wave refraction - Jaws, Maui.
Image used with permission - Katie M. Fearing and Robert A. Dalrymple.
Click here to see the movie.
For straight coasts with parallel contours, refraction decreases the angle between the approaching wave and the coast, and diffraction causes a spreading of energy along the crests.
Consequently, change in wave height and direction at any point along the coast is a function of wave period, direction of approach, and configuration of the bottom contours.
Nearshore Currents
When waves break at an angle to the beach, the momentum of the breaking wave generates onshore currents that flow in the direction of propagation of the breaking wave and its bore. The pile up of water along the shore causes longshore currents that flow parallel to the beach inside the breaker zone. The water in the longshore current returns seaward as rip currents. The spacing between rip currents is usually two to eight times the width of the surf zone.
Nearshore river discharge and transport - Currents of the nearshore circulation system produce a continuous interchange of water between the surf zone and offshore areas waters, distributing nutrients and dispersing runoff from the land.
Click on buttons to compare.
Click to see photo of flood discharge.
Longshore currents may reach velocities of 2.5 m/s (8 ft/s). Rip currents have been measured in excess of 1.5 m/s (5 ft/s).
Headlands, breakwaters, and piers influence the circulation pattern and alter the direction of currents flowing along the shore. Where a straight beach is terminated on the down-current side by points or other obstructions, a pronounced rip current extends seaward.
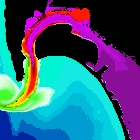
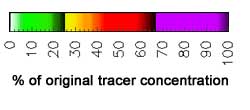
Tidal flushing model - San Diego Bay, California
A simulation showing percent of initial tracer concentration forced by a 60 cm. tidal amplitude.
Click here for the movie. Movie requires QuickTime.
Image and movie courtesy John Helly, San Diego Supercomputer Center, UCSD.
Click here for more information.
Tides
The lunar semidiurnal tide, with a period of 12.42 h, is the principal world tide, and its amplitude is controlled by local ocean bathymetry. Tides generate shelf and coastal currents that are important to transport of finer sediments. Velocities over the southern California shelf may reach 15-20 cm/s at times.
The tidal range determines the elevation of wave attack at the shoreline. Extreme tides influence inundation and flooding and are amplified by sea level changes associated with El Niño events.
Tidal currents are the primary sediment transport force inside enclosed bays and harbors, and tidal flow through the entrances may be very fast.
©2002-2003 by the Regents of the University of California and the Kavli Institute.
All rights reserved.
Last modifed Friday, June 25, 2003